What is a Dashboard?- Definition
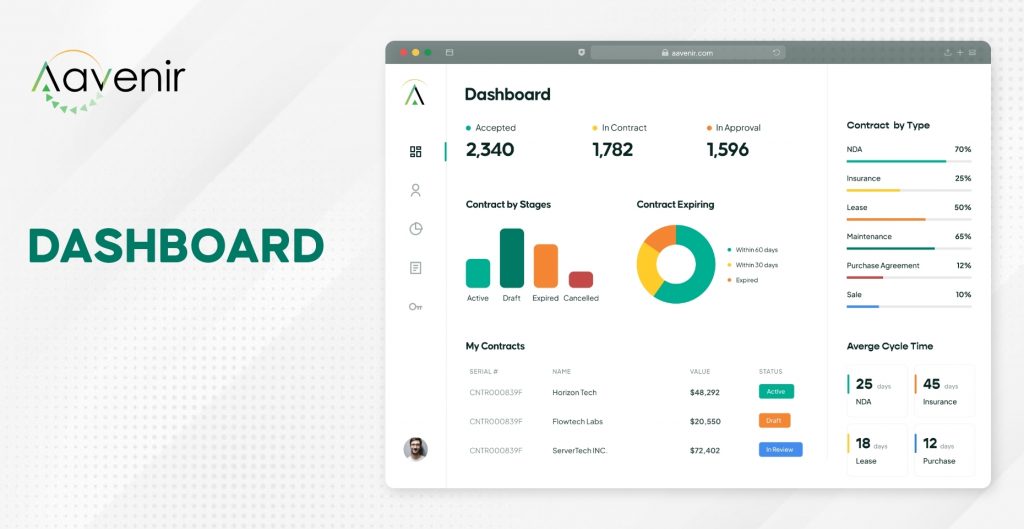
A data dashboard is a data visualization tool that tracks, analyses, and displays key performance indicators, data points, and metrics. For example, a dashboard can be used to monitor the general health of your company, department, or a specific process.

A dashboard is a visual representation of all of your data. While it could be used in several different ways, its primary purpose is to provide information at a glance, such as KPIs.
A dashboard is often located on its own webpage and receives data from a linked database. In many situations, it's customizable, allowing you to select the data you want to see and whether you wish to include graphical representations to help you visualize the figures.
Benefits of Using Dashboards
Dashboards enable various professionals to evaluate performance, generate reports, and set estimations & goals for future work. Below mentioned are the significant benefits of using a dashboard.
Easy to read
A data dashboard does not require you to be a data analyst to utilize and comprehend. Instead, dashboards should be simple to understand. For example, when you use dashboard design principles and best practices, you can highlight crucial data elements that everyone can see and understand at a glance. Your dashboard should be constructed such that you can understand the data even if you don't work in marketing or finance.
Save time by reducing or eliminating manual reporting tasks
It goes without saying that data dashboards save time. You don't have to go to multiple sources or spreadsheets to get your data and then put it into a report. Dashboards perform all of the grunt work for you! Invest the time upfront to set up and develop a dashboard that will pay for itself tenfold. Reports can be generated automatically with your data in real-time and from any location.
Monitor multiple metrics and KPIs at once
When a change occurs inside a department, whether positive or negative, it can have a ripple effect on your organization. Putting your data on a dashboard makes everything much more manageable. Make use of a dashboard to dig deep and establish a correlation between your measurements and KPIs to discover what's working — and what isn't. Monitor your data and KPIs on a centralized dashboard and make real-time changes to your business practices.
Consistent and timely cross-functional communication
Dashboards enable everyone in the organization to make and evaluate business decisions, resulting in greater organizational synergy. Executives and leaders no longer need to seek data from a data analyst because the data is readily available on a dashboard. Analysts can work in the background while users have instant access to their required information. It's a win-win situation!
What are the Different Types of Dashboards Transforming Source-to-Pay Decisions?
Optimizing processes with insightful reports will generate value across the board, allowing businesses to thrive in our competitive economy Below mentioned are different areas within the source-to-pay landscape where the dashboard is doing wonders.
Procurement Dashboards
With the use of procurement KPIs such as compliance rate, purchase order cycle time, supplier defect rate, and others, purchasing managers can efficiently track, evaluate, and optimize all acquisition activities inside a firm.
Contract Dashboards
Depending on the demands of the organization, contract management dashboards can hold different use cases. Dashboards can be set to display CLM ad-hoc reports and a variety of other essential statistics on the home screens of CLM software users. Leading contract management solutions like Aavenir Contractflow offer highly configurable dashboards which can cater to every need of your contract manager.
Accounts Payable Dashboards
AP dashboards provide real-time financial and operational data and can be customized to suit different roles and display unique key performance indicators (KPIs) that meet the needs of the user. This contains KPIs such as total, current, and past-due accounts payable, as well as invoice lifecycle data and vendor information. The dashboard can also track the AP department's performance, such as processing output and capacity to obtain rebates or discounts.
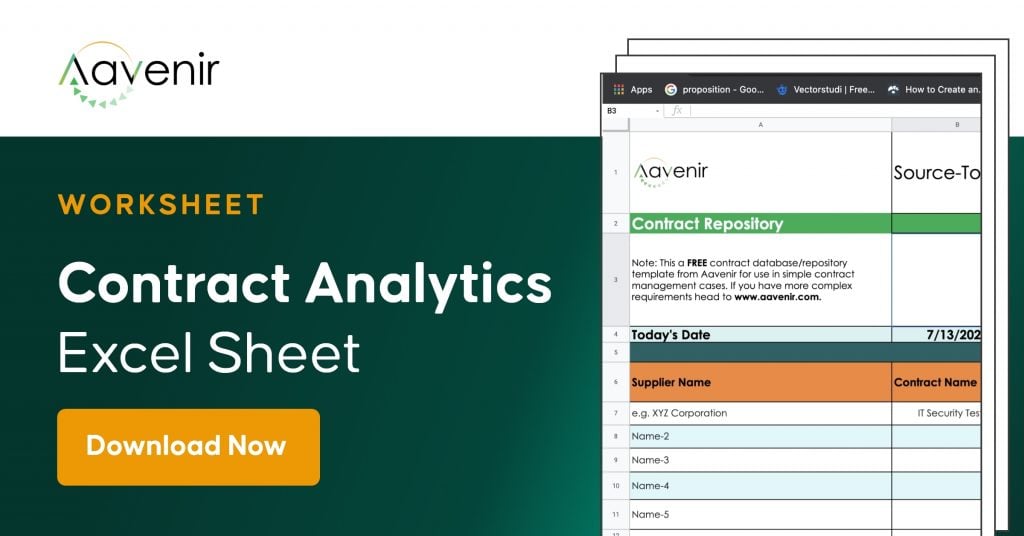
Explore Additional Resources To Know More


